
Preface
The 2021 season of Formula 1 is the first one I watched from start to finish and I am a fan of both Hamilton and Bottas ever since. I just finished my studies and I am about to have my first job interviews. To make the preparation for those interviews more interesting, I decided to crunch some numbers of the seasons during which Bottas was Hamilton’s teammate. These numbers aren’t particularly insightful on their own, but they can be used as a starting point for further deeper analysis in the future.
Since this is job interview preperation, I will briefly go over some Data Engineering details at the start. Feel free to skip ahead to the Data Analysis right away, if that is not of interest to you.
Data Source
The used data can be found on Kaggle: Formula 1 World Championship (1950 - 2022). The original data source is the Ergast Developer API. The maintainers on Kaggle provide 14 CSV files containing information about drivers, constructors, and all kinds of results. The data is built in a relational format, so it can easily be imported into a SQL database of choice. In this case, SQLite is entirely sufficient. Additionally, some transformations will be made with the Python library Pandas.
Data Engineering
The source code can be found on GitHub
Initial data transformations are done in SQL and the results are in the /data folder. Any further transformations done with Pandas are stored in the /hamilton-vs-bottas folder.
The first analyzed data is about the race pace. For that, the lap times of Hamilton and Bottas from 2017 to 2021 were extracted. Transformations are explained in detail for this first analysis and omitted for the others. All transformations can be found in the mentioned repository and if these steps are not of your interest, just skip ahead to the analysis.
SELECT
lap_times.raceId, lap_times.driverId, lap_times.lap, lap_times.position, lap_times.milliseconds,
races.year, races.round, races.name, races.date,
drivers.code, drivers.forename, drivers.surname, drivers.dob, drivers.nationality,
circuits.name, circuits.country,
results.statusId
FROM
lap_times, races, drivers, circuits, results
WHERE
(lap_times.driverId = 1 OR lap_times.driverId = 822)
AND
results.statusId = 1
AND
(year >= 2017 AND year <= 2021)
AND
lap_times.driverId = drivers.driverId
AND
lap_times.raceId = races.raceId
AND
races.circuitId = circuits.circuitId
AND
results.raceId = lap_times.raceId
AND
results.driverId = lap_times.driverId
This data contains the lap time of each lap that Hamilton and Bottas drove. To further analyze this data, it was transformed with Pandas.
First, the mean race pace was created.
data = pd.read_csv("data/lap_times_ham_vs_bot_without_dnfs.csv")
means = data.groupby(["race_name", "circuit_name", "year", "code"])["milliseconds"].mean().reset_index()
means.to_csv("hamilton-vs-bottas/racepace-means-alphabetical.csv", index=False)
This data is now in the long format, but we require wide format data for the next step, in which we calculate the Deltas. Delta here simply means the difference in mean race pace between the drivers.
data = pd.read_csv("hamilton-vs-bottas/racepace-means-alphabetical.csv")
data = data.pivot(index=["race_name", "circuit_name", "year"], columns="code", values="milliseconds").reset_index()
data.to_csv("hamilton-vs-bottas/racepace-means-alphabetical-wide.csv", index=False)
Before we calculate the Deltas, we remove the 2021 race in Belgium. This is an outlier race, that did not start due to rain.
data = pd.read_csv("hamilton-vs-bottas/racepace-means-alphabetical-wide.csv")
data = data.drop(data[(data["circuit_name"] == "Circuit de Spa-Francorchamps") & (data["year"] == 2021)].index)
data.to_csv("hamilton-vs-bottas/racepace-means-alphabetical-wide-without-spa-2021.csv", index=False)
Finally, we can calculate the Deltas.
data = pd.read_csv("hamilton-vs-bottas/racepace-means-alphabetical-wide-without-spa-2021.csv")
data["delta"] = data["BOT"] - data["HAM"]
data.to_csv("hamilton-vs-bottas/racepace-means-alphabetical-wide-without-spa-with-deltas.csv", index=False)
Data Analysis
All visualizations are created with R and ggplot.
Racepace
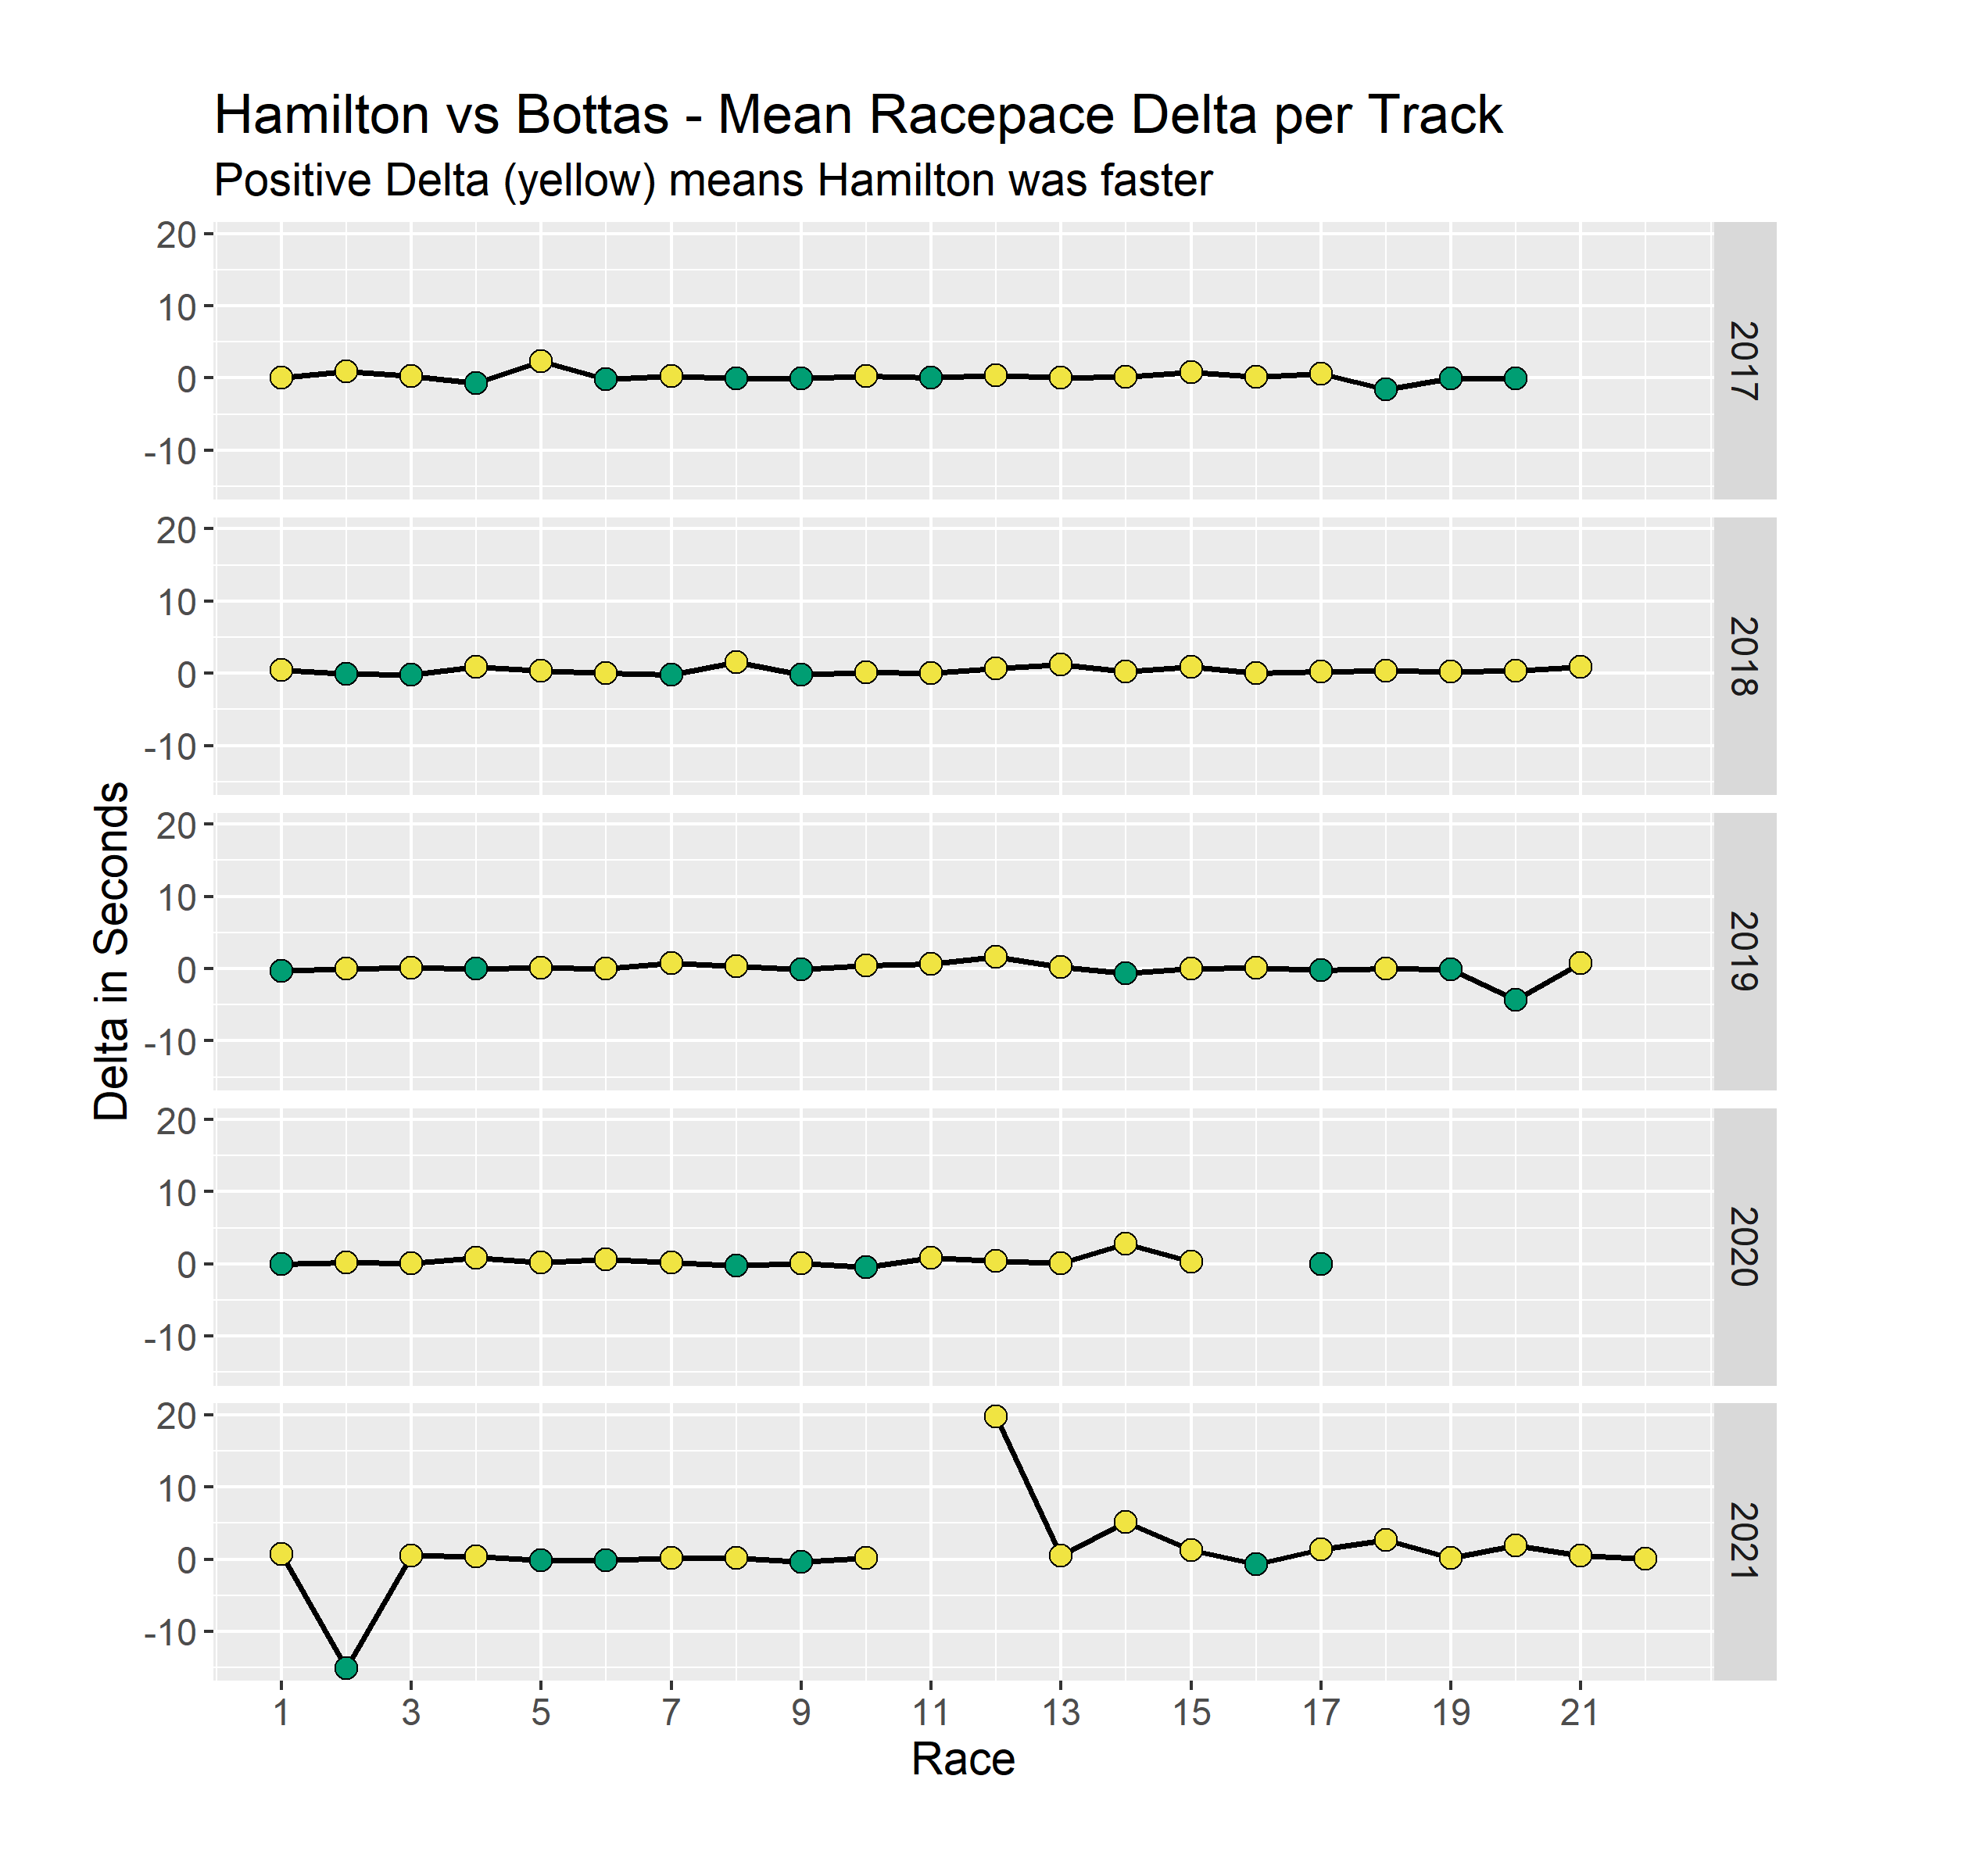
Here one can see two strong outliers in 2021. Race 2 and 12 favor Bottas and Hamilton respectively. In race 2 there was a DNF, which means that one of the drivers did not finish the race in case you are not familiar with Formula 1. So next, all races containing DNFs were removed.
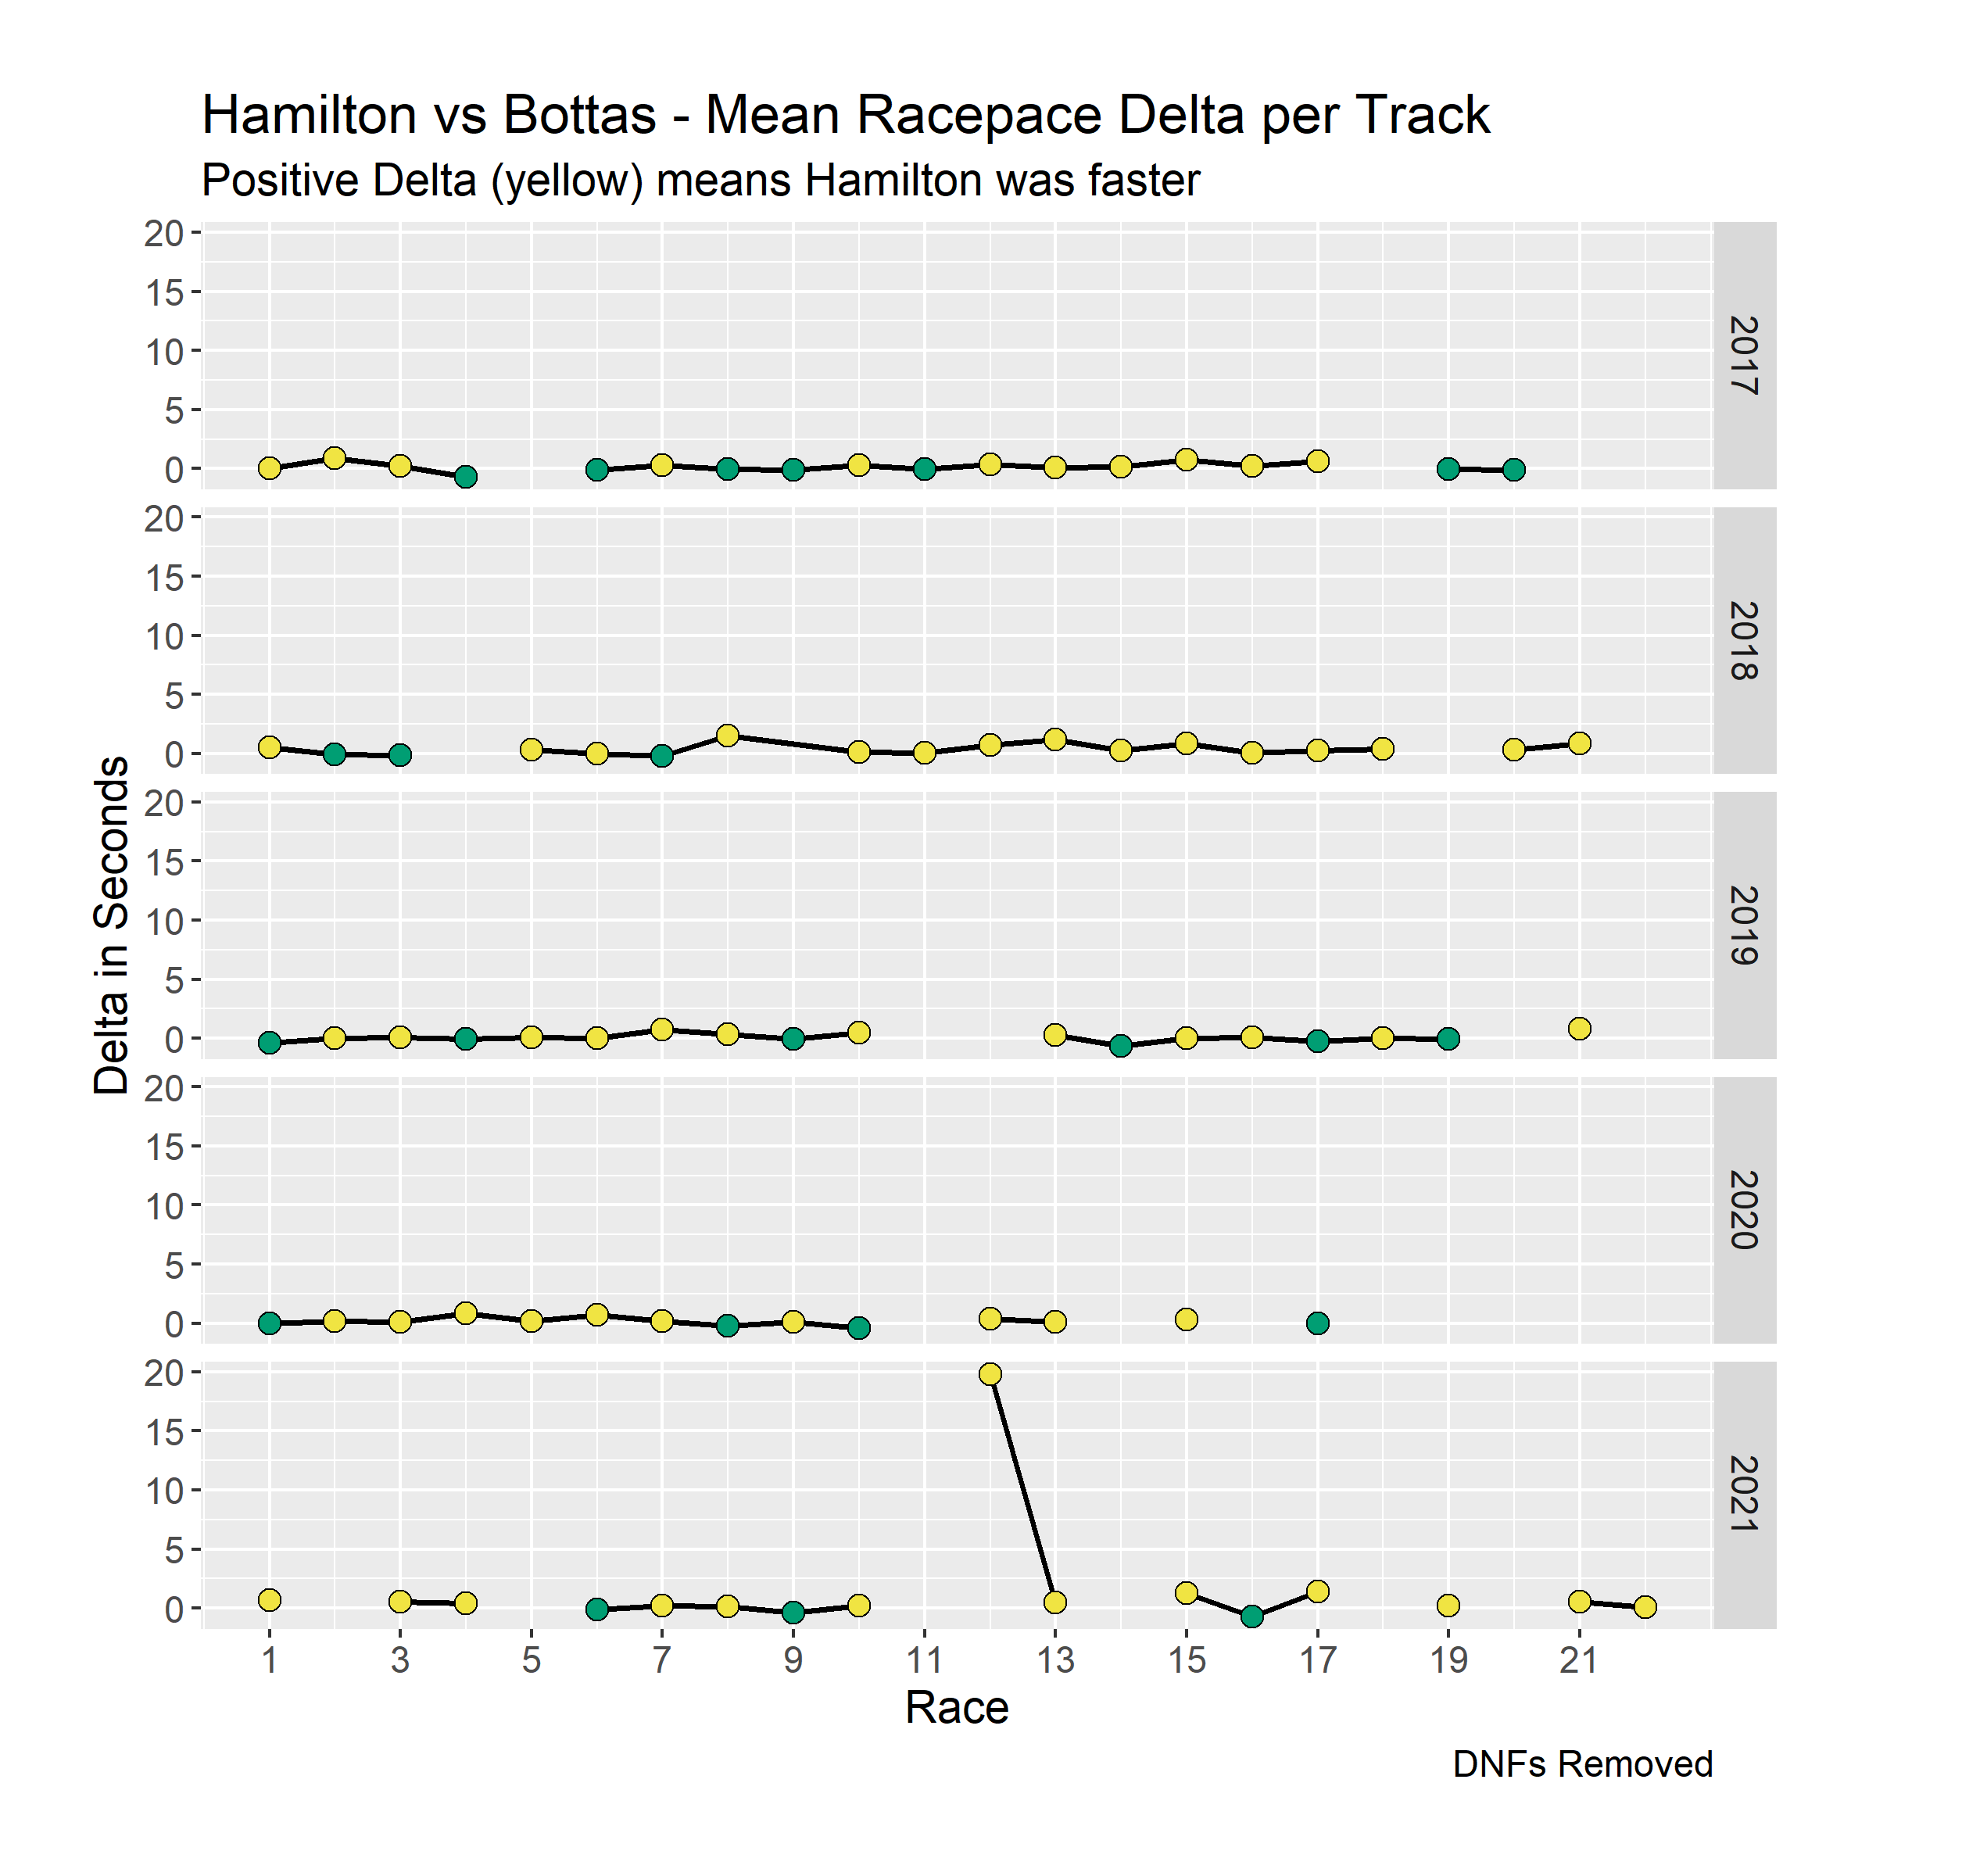
One can see, that not only did the second race of 2021 get removed but also a couple of others too. This is good because the races with DNFs skew the data. However, the outlier race 12 in 2021 was not removed. This is because race 12 of 2021 is the Belgium Grand Prix, which only ran for two laps due to rain. We remove that race too.
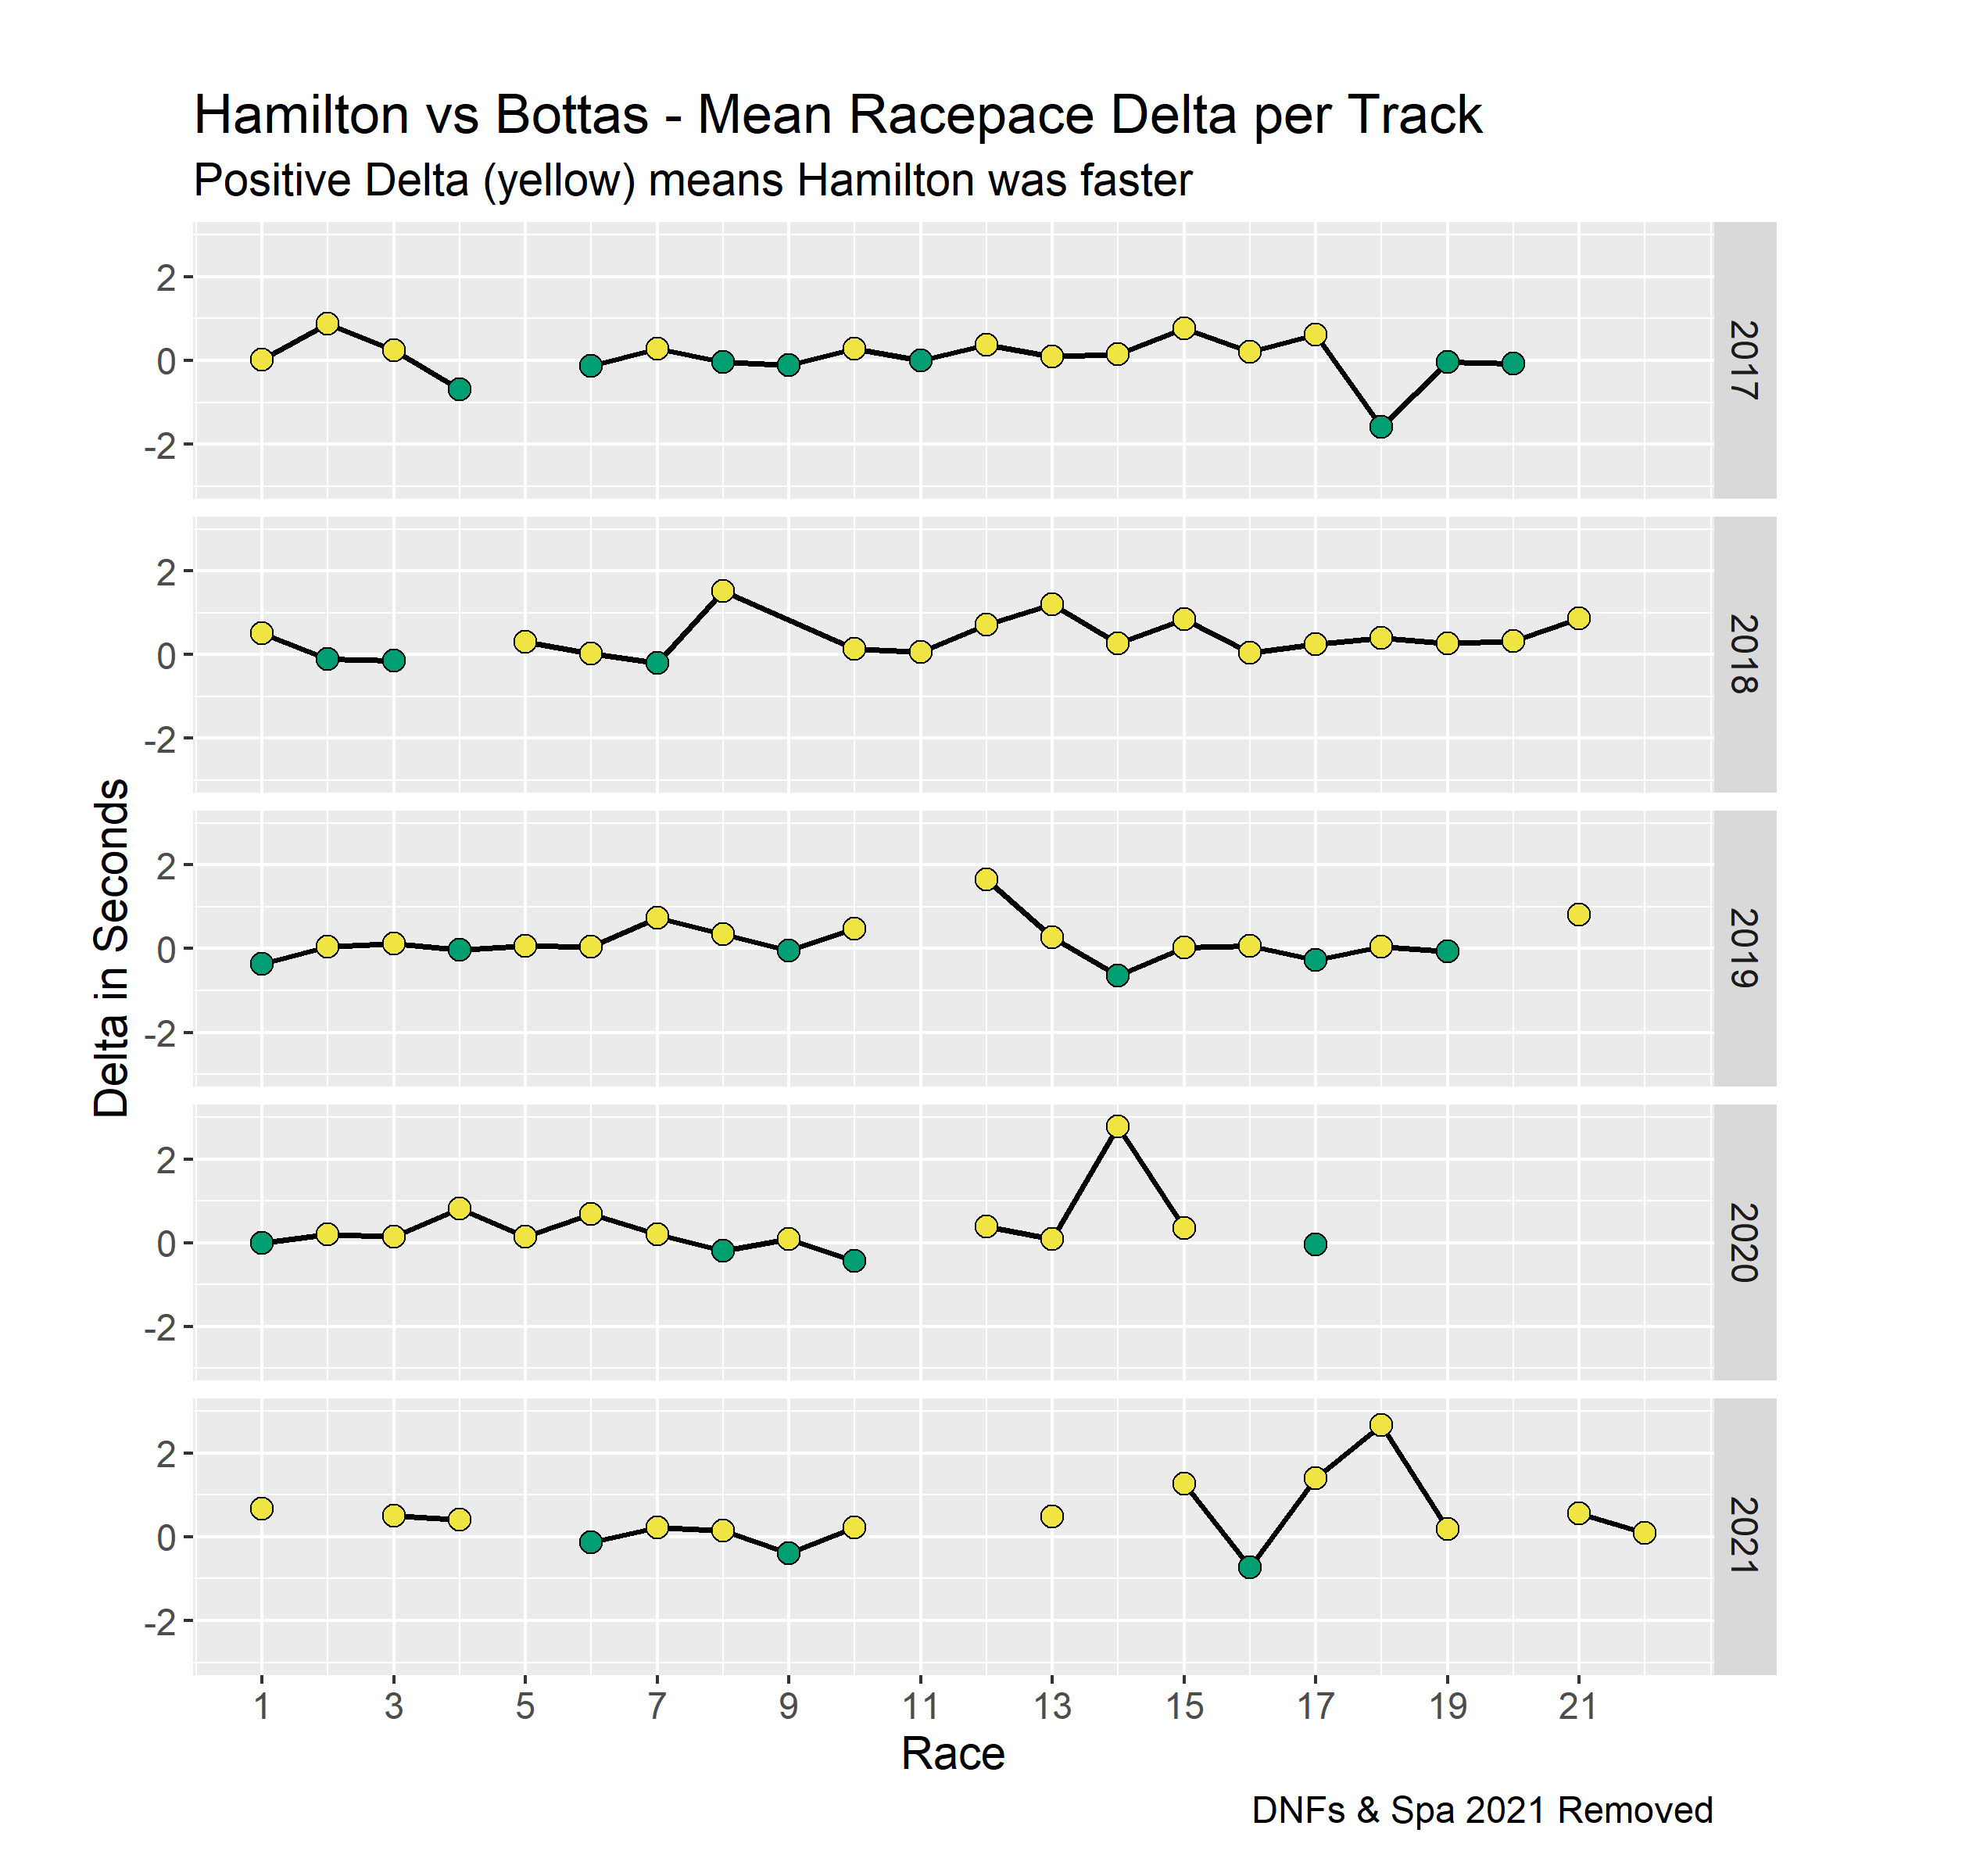
Finally, we can analyze the filtered data. The years in which Bottas contested Hamilton for the Championship were 2019 and 2020. Race pace-wise Bottas was faster 10 times, while Hamilton was faster 24 times. Also, when Hamilton was faster than Bottas, he was faster by a bigger margin. Similar trends can be found in the other seasons too, although it is noteworthy, that especially in the later races of the seasons Mercedes has favored Hamilton since he was the one competing for the Championship.
The plots above show the performance chronologically, the races are sorted from first race to last race. In the following plot, the performance sorted by racetrack is analyzed instead.
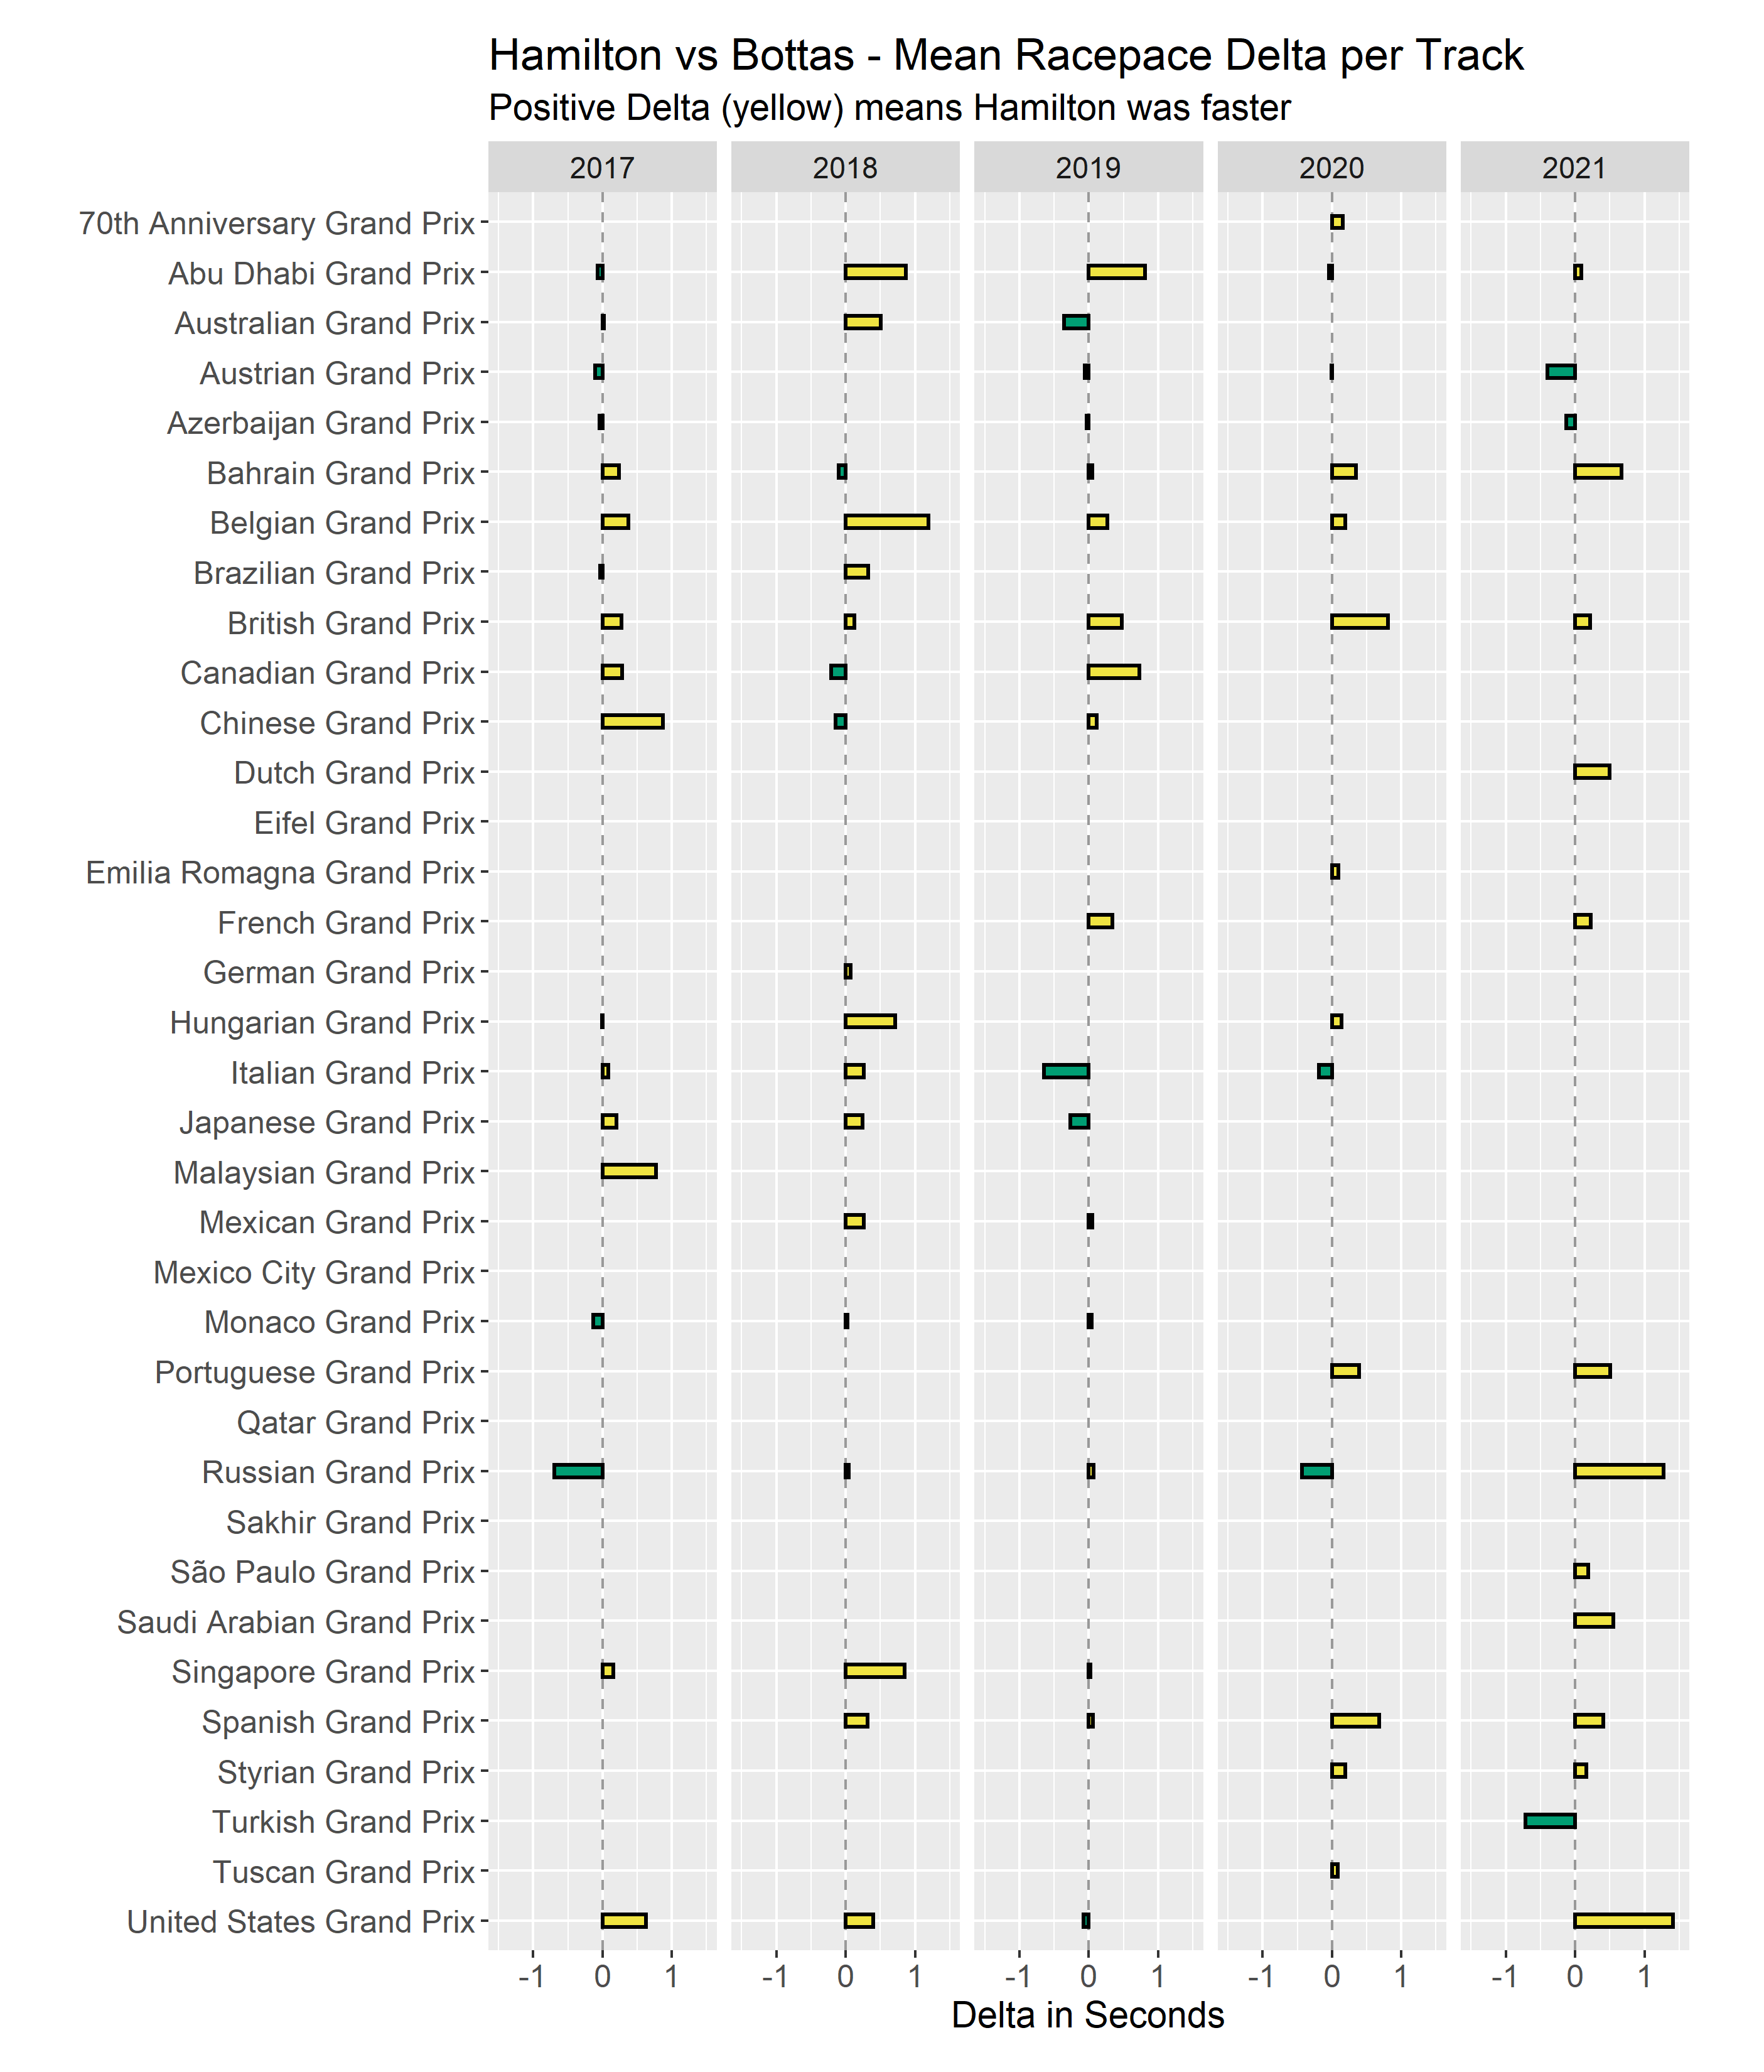
A particularly strong track for Hamilton is his home race, the British Grand Prix. Hamilton is unbeaten by Bottas in front of his home crowd. Spa (The Belgian Grand Prix) and Barcelona (The Spanish Grand Prix) are also unbeaten tracks for Hamilton. On the other hand, Bottas has outperformed Hamilton both on the Austrian Grand Prix and in Baku (The Azerbaijan Grand Prix). Exceptionally strong races by Bottas can be found in the 2017 Russian Grand Prix, the 2019 Italian Grand Prix, and the 2021 Turkish Grand Prix.
DNFs
DNFs are another interesting aspect to analyze. Hamilton, who is self-proclaimed blessed, is known to have very DNFs, while Bottas is known for some unlucky DNFs such as his Pitstop in Monaco in 2021.
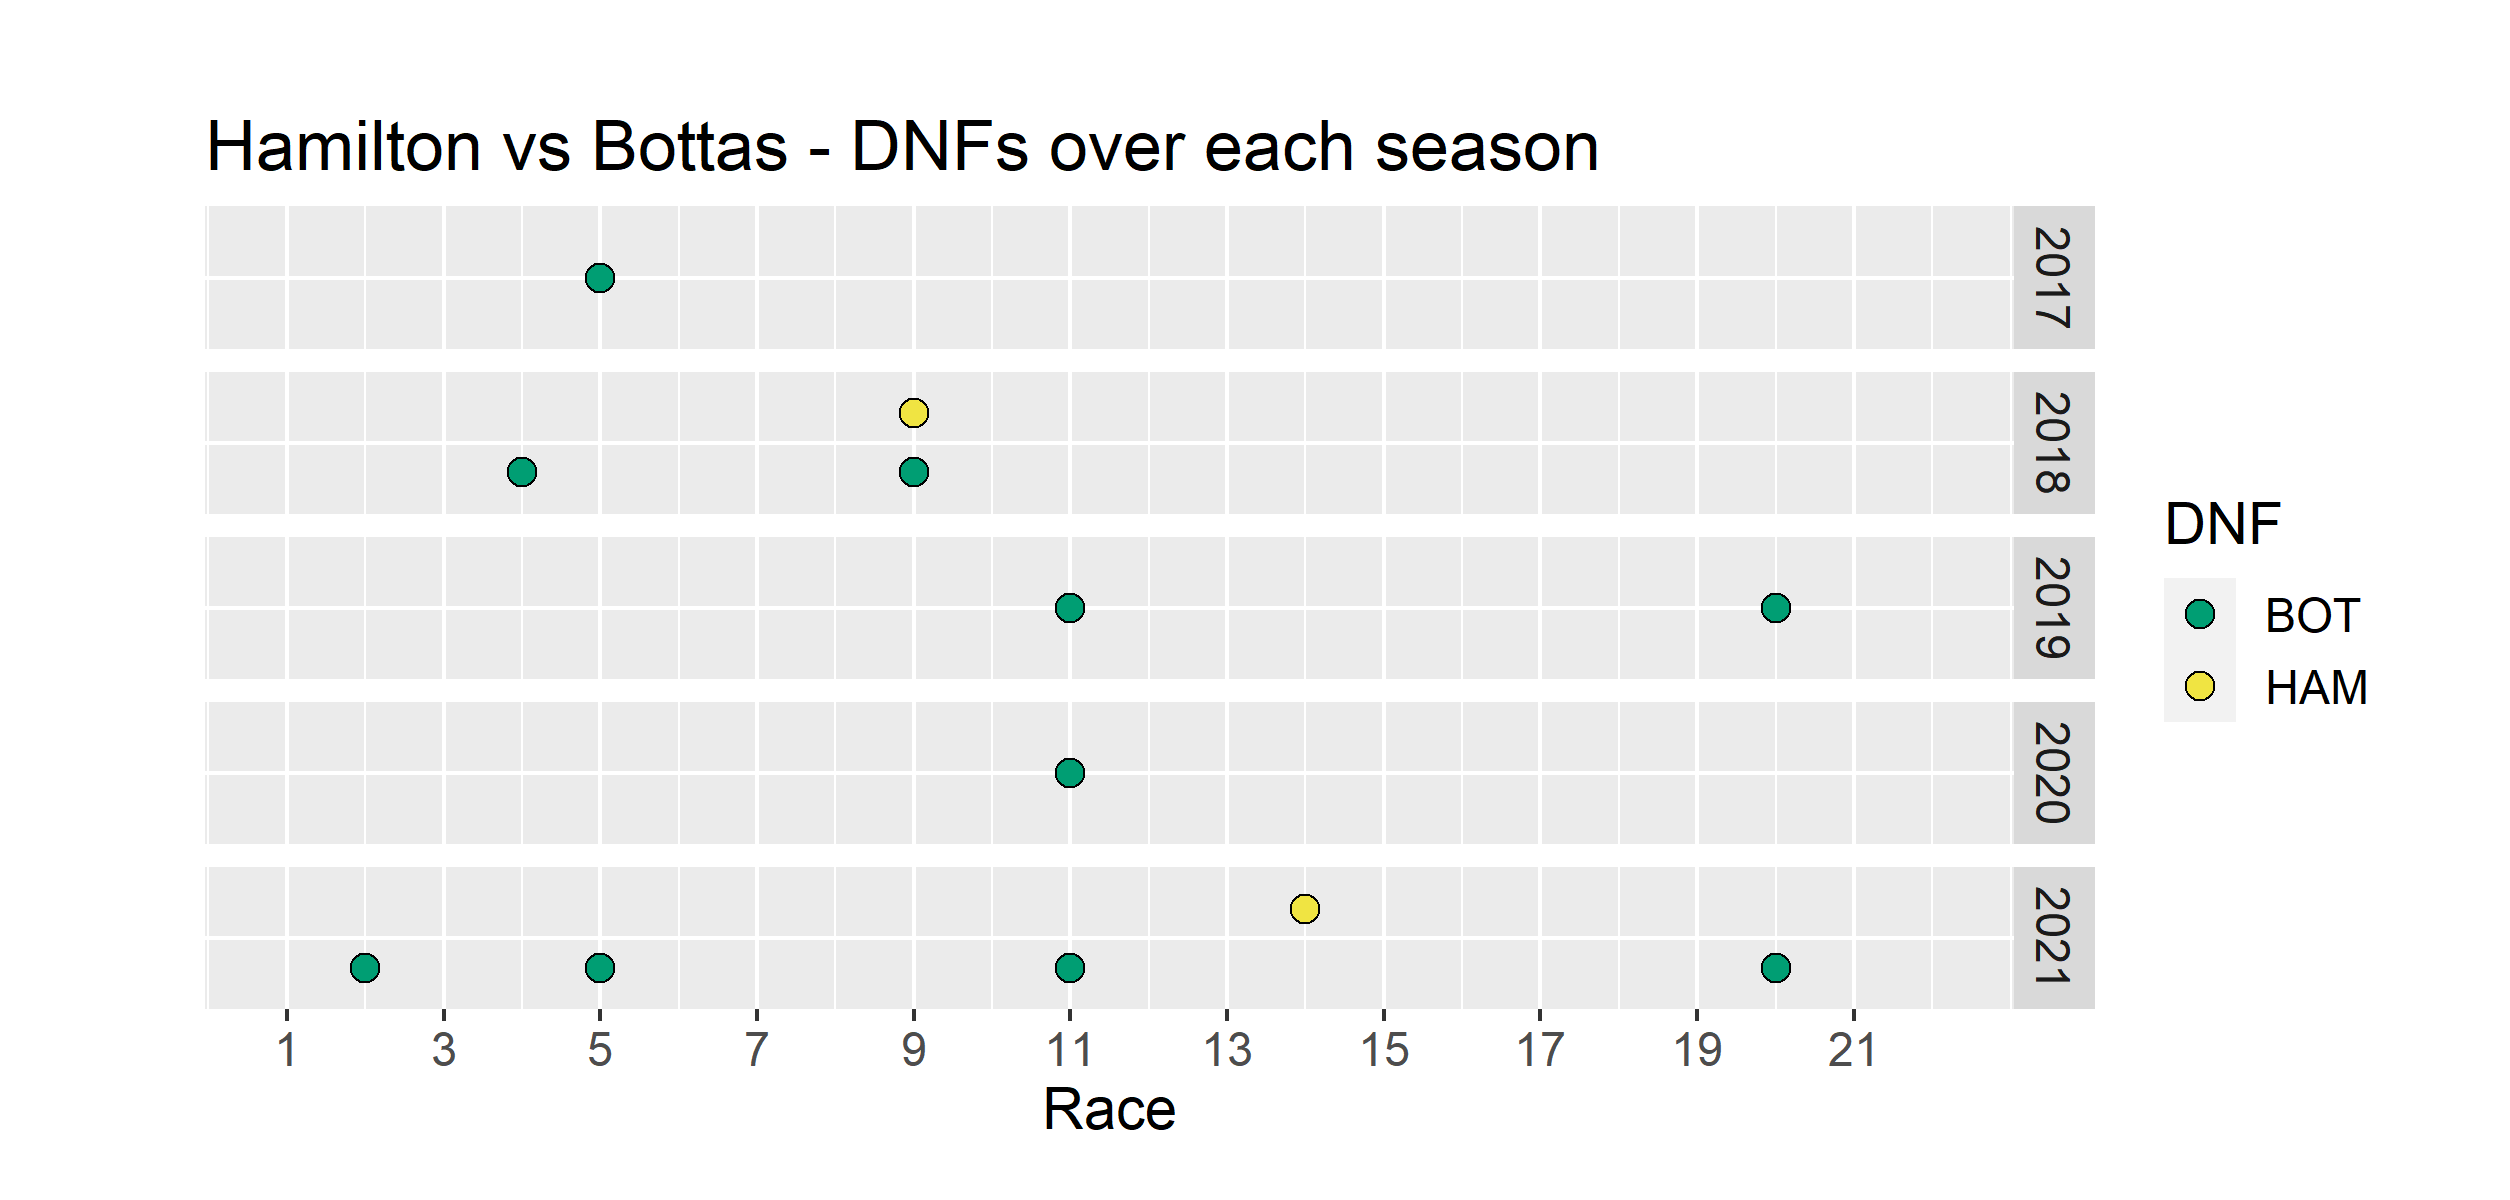
In the plot, we can see, that Hamilton has DNFed twice from 2017 to 2021, while Bottas has DNFed 10 times. Noteworthy is that Bottas has DNFed every single time in the 11th race since 2019. At the time I am writing this, the 10th race of the 2022 season, the British Grand Prix, has just finished and the 11th race in Austria is around the corner. Hopefully the next time we analyze this type of data, we can say, that Bottas broke this curse.
Standings
Next, we will look at how close Bottas and Hamilton were points-wise. In grey, there will be a dotted line to indicate at which race the Championship was decided. It is important to note, that this refers to the point at which Hamilton won the Championship, Bottas has been out of the Championship race earlier than that in 2017, 2018, and 2021.
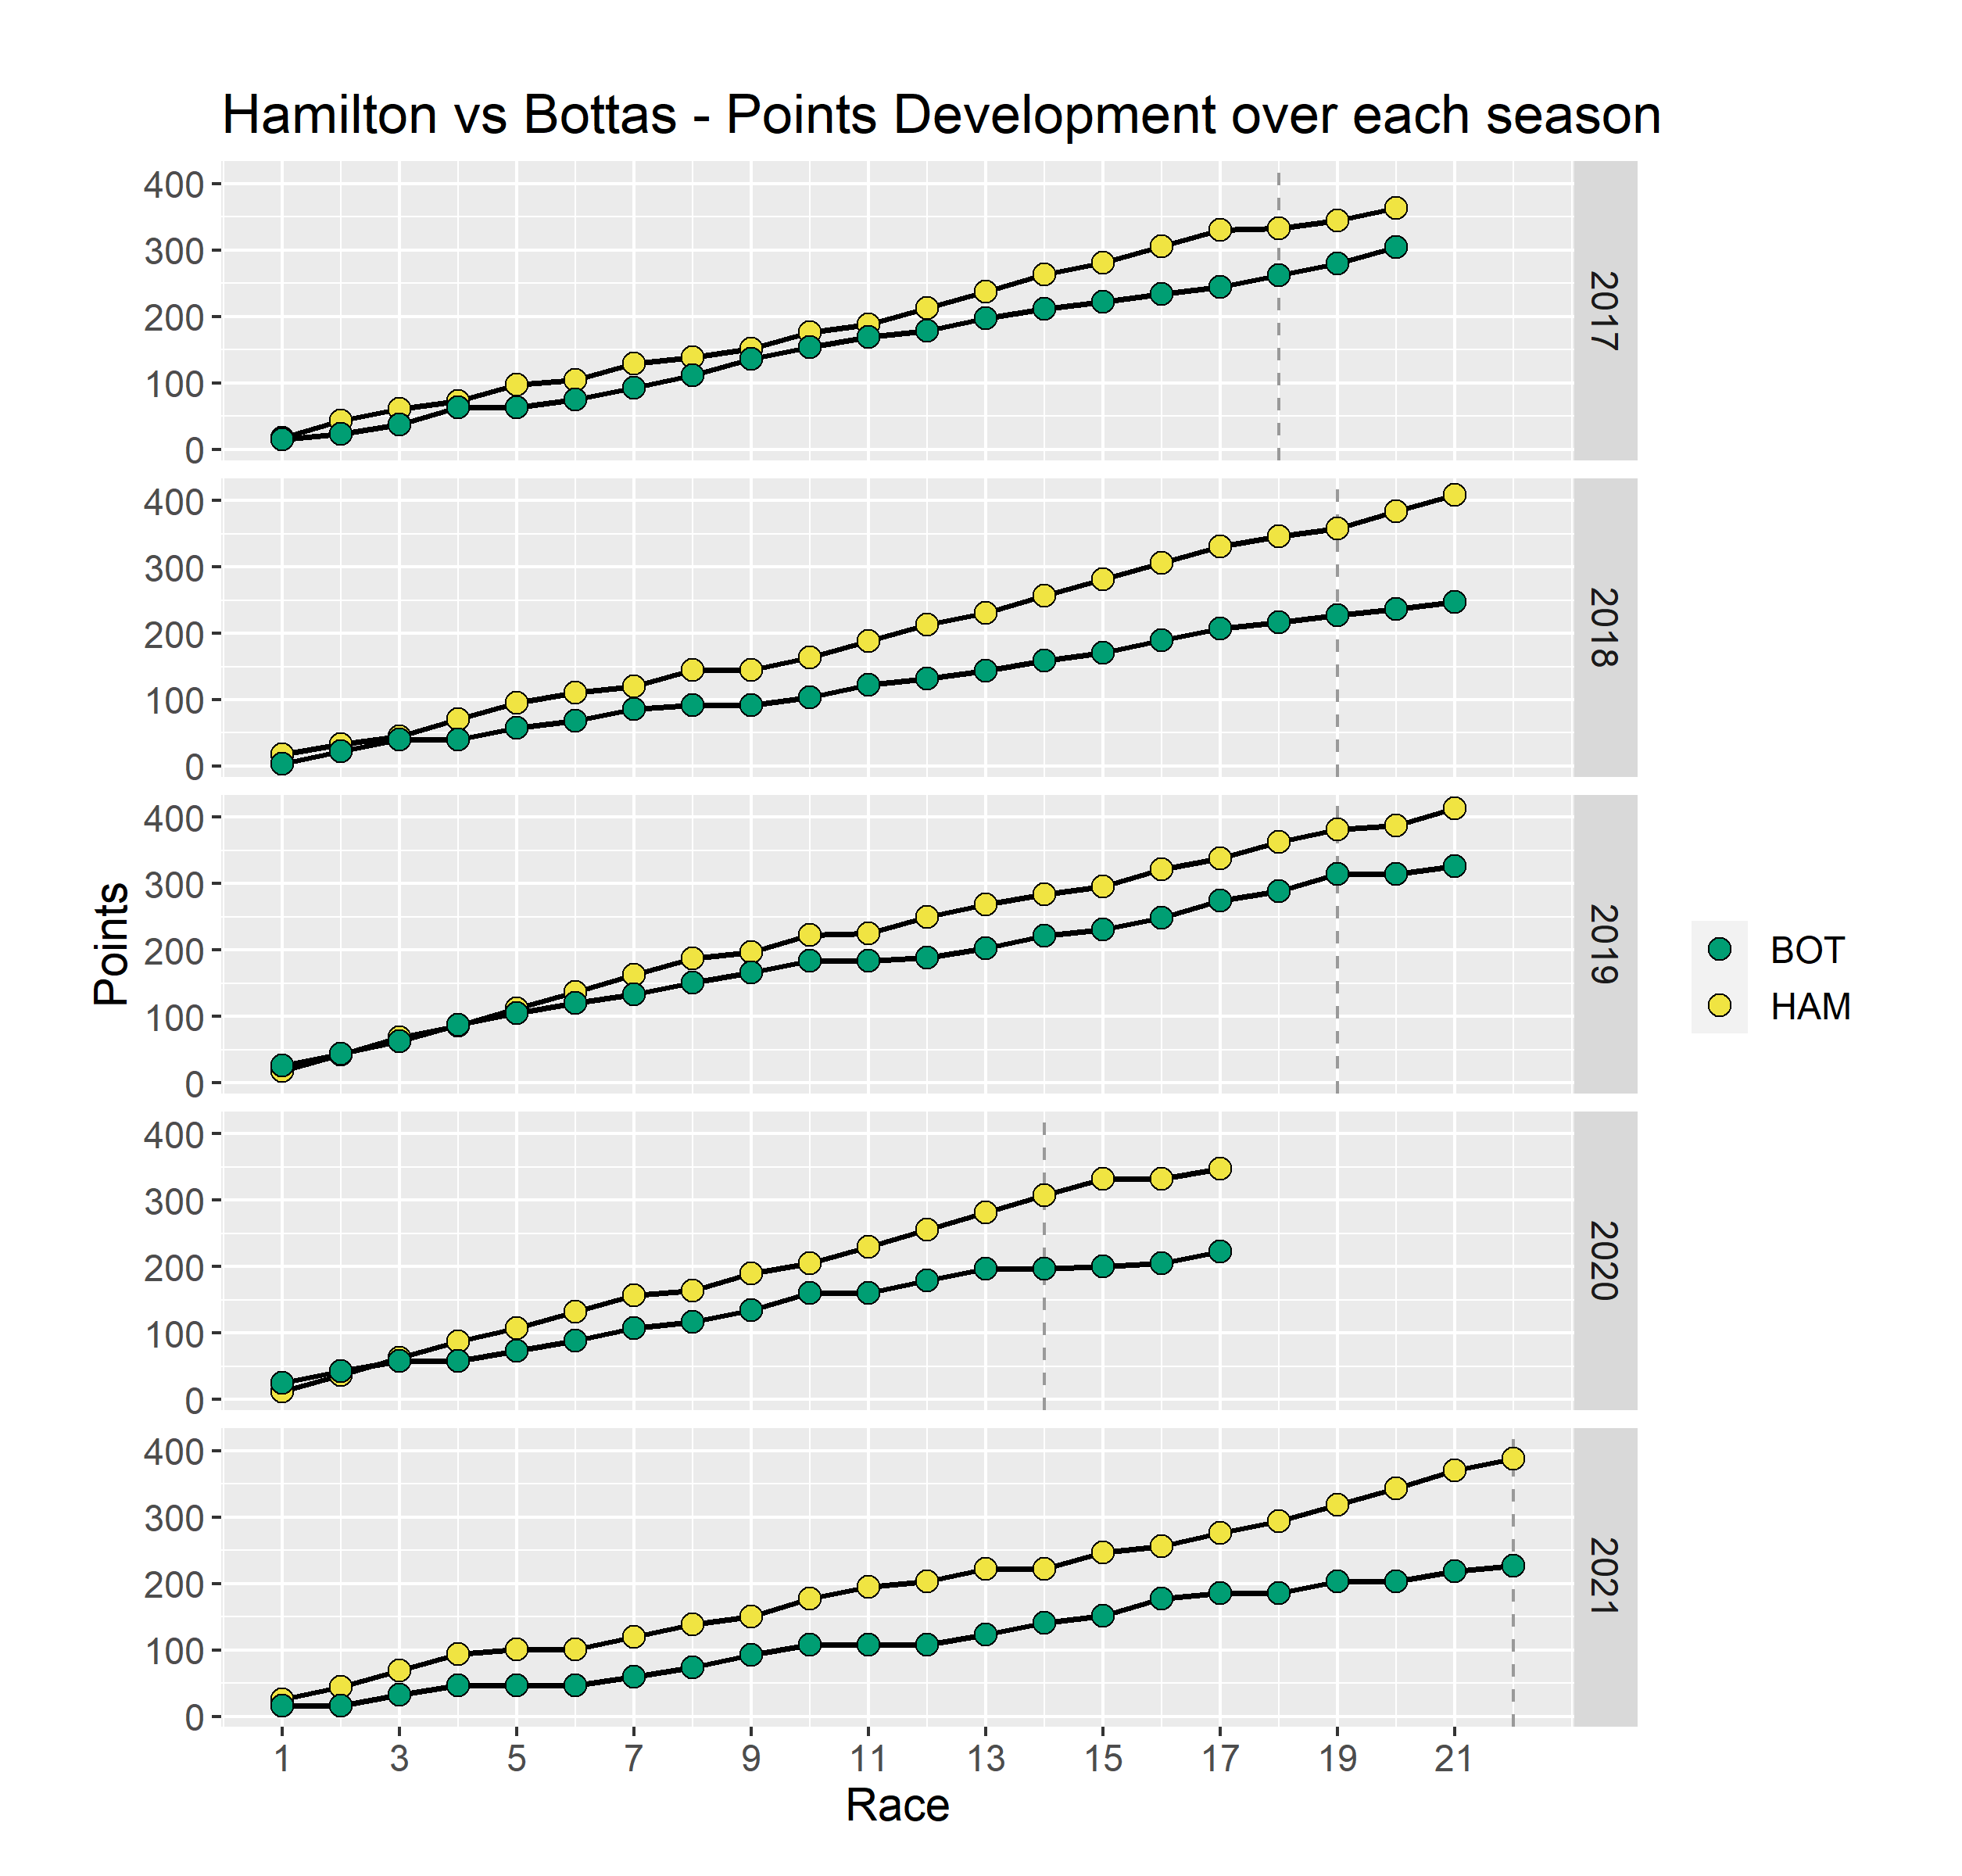
Throughout all seasons Bottas was never ahead in points after the 5th race. Hamilton quickly built a fair margin in points and kept that throughout all the seasons, when compared with Bottas.
Positions
Next, we will move away from comparing only Hamilton and Bottas. Instead, we will look at the Championship Contenders of each year.
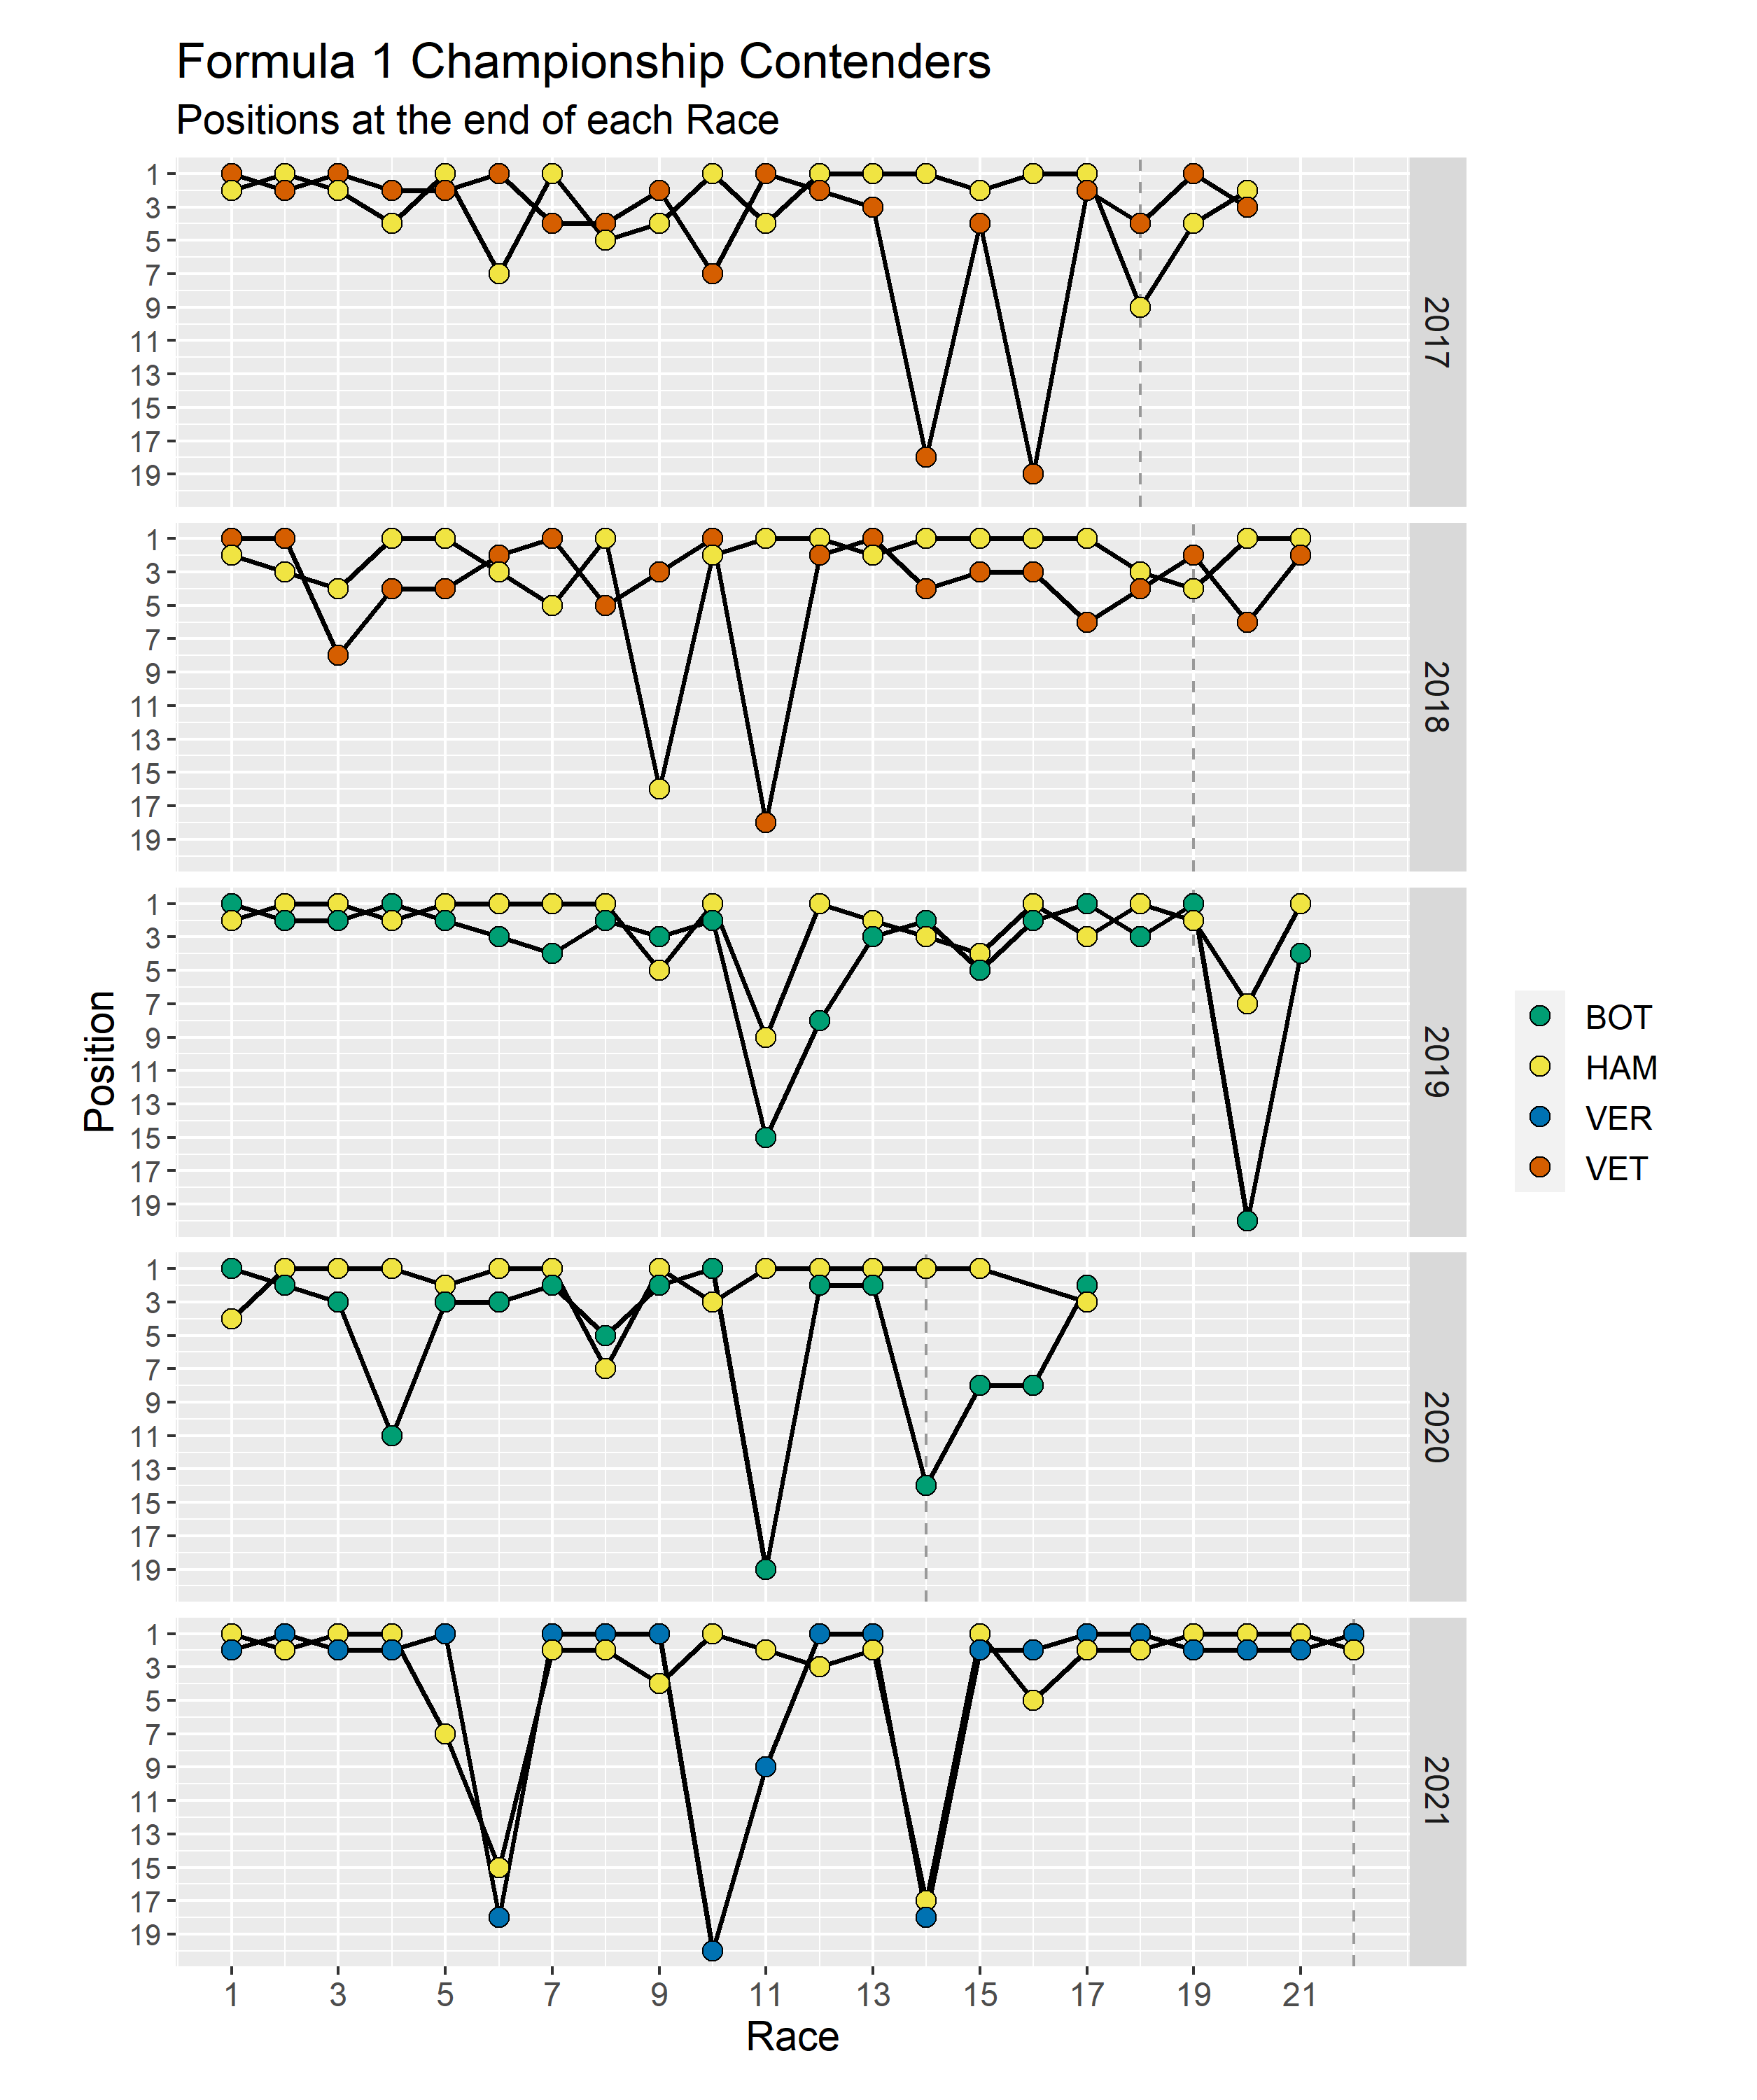
It is known, that Hamilton is particularly strong in the final phase of the Championship. First, let’s look at his title fight with Vettel in 2017 and 2018. In 2017 starting with race 12, he finished 1, 1, 1, 2, 1, 1. Then a 9th place finish was enough for him to win the Championship with two more races left. 2018 was very similar, starting with race 12 he finished 1, 2, 1, 1, 1, 1, which then allowed him to win the Championship with a 3rd and 4th place, with two more races left. During both of these Hamilton streaks, Vettel has struggled a lot. Vettel finished 2, 3, 18, 4, 19, 2 in 2017 and 2, 1, 4, 3, 3, 6 in 2018.
The finish of 2019 against Bottas was not as smooth 2017 and 2018. Hamilton and Bottas had a strong exchange of blows starting with race 13. Overall, Bottas still lost too many points prior to that and Hamilton won the Championship with two races left. 2020 was a very dominant season for Hamilton. The season had a couple fewer races than the others due to covid and Hamilton still concluded the Championship with three races left. This is also underlined by the mean race pace per year. In 2019 Bottas was 24 milliseconds faster on average, while Hamilton was 374 milliseconds faster on average in 2020.
Finally, we can look at the 2021 season, which is the first season Hamilton lost since 2016. The Championship was decided in the very last race, with a really small margin. The 2021 season is the closest of all analyzed seasons. Hamilton had a very strong final phase here too. Starting with race 17, he finished 2nd twice behind Verstappen. At this point, the pressure was extremely high and Hamilton had to win the next three races, which he did.
Pitstops
Formula 1 is of course a Constructors Sport. No matter how good a Driver is, if the car is not good enough, a Championship is simply not possible. Building a good car is only half the battle. During the races, the Team has to make the right calls regarding strategy and perform well during Pitstops. In the following, we will compare how much time the Championship Contenders lost or gained during their Pitstops. Each bar in the following plot represents the Delta between two Pitstops. If for example, Hamilton has a two Pitstop race and Verstappen has a three Pitstop race, there will only be two bars for that race: One for comparing Hamilton’s first Pitstop to Verstappen’s first Pitstop and another one for comparing Hamilton’s second Pitstop to Verstappens second Pitstop. Additionally, we exclude any Pitstops with Deltas larger than 4 seconds. This is done to avoid comparing a normal Pitstop in which only the tyres are changed to a Pitstop in which a damaged front wing had to be replaced.
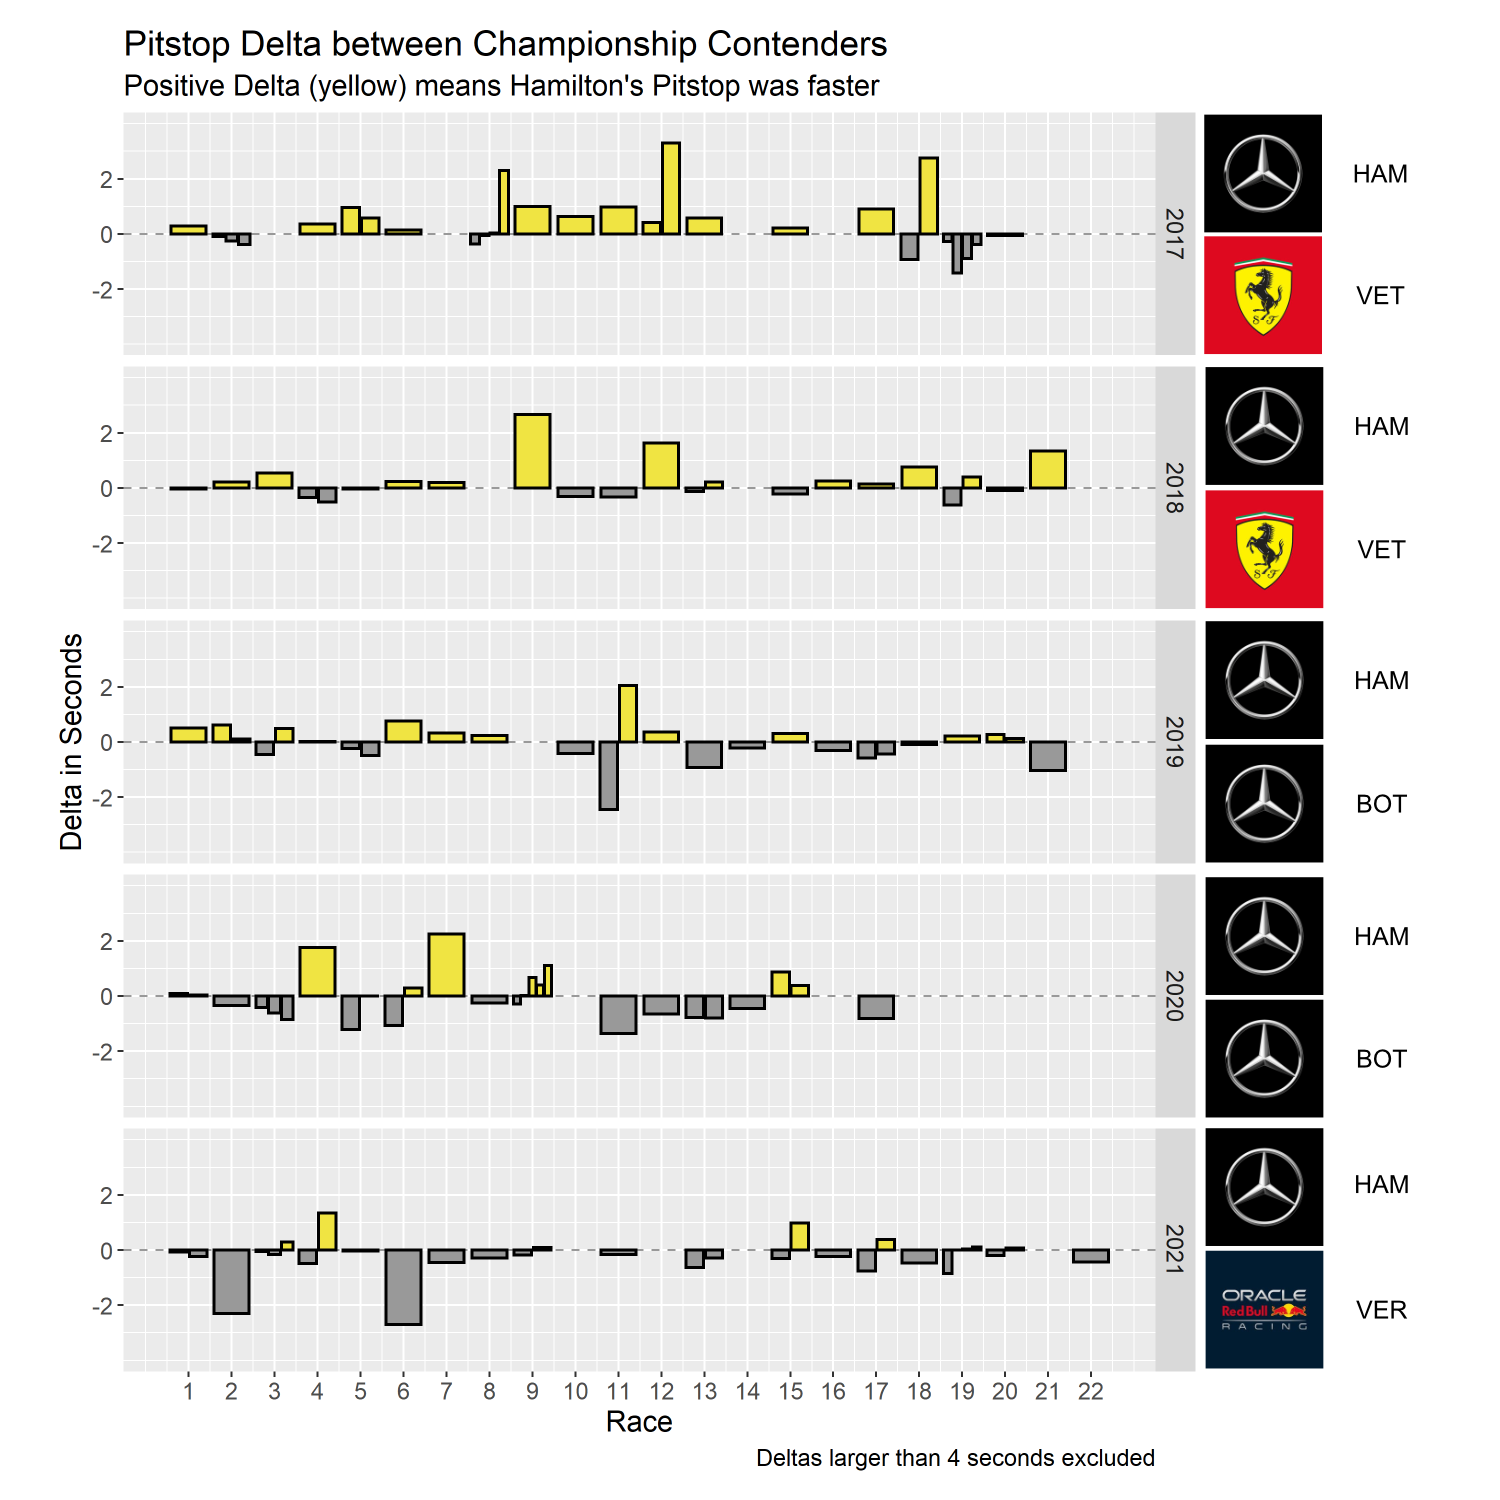
In 2017 and 2018 the results are fairly close in terms of how often each driver gained an advantage. Vettel gained time 21 times, while Hamilton gained time 28 times. However, the overall mean time gain per Pitstop for 2017 and 2018 respectively was 381 and 271 milliseconds in favor of Hamilton.
In 2019 and 2020 the Pitstops are a lot closer. Overall Bottas gained 49 milliseconds in 2019 and 79 milliseconds in 2020 on average.
Red Bull is known for their fast Pitstops. This is represented by the data as well. In the 30 compared Pitstops Mercedes only beat Red Bull 9 times in 2021. On average Verstappen gained 268 milliseconds per Pitstop during that season.
Conclusion
As mentioned at the start, this is just job interview preparation and the data should not be overinterpreted. This was a fun way for me to refresh my SQL, Pandas, and ggplot knowledge.